Gallery
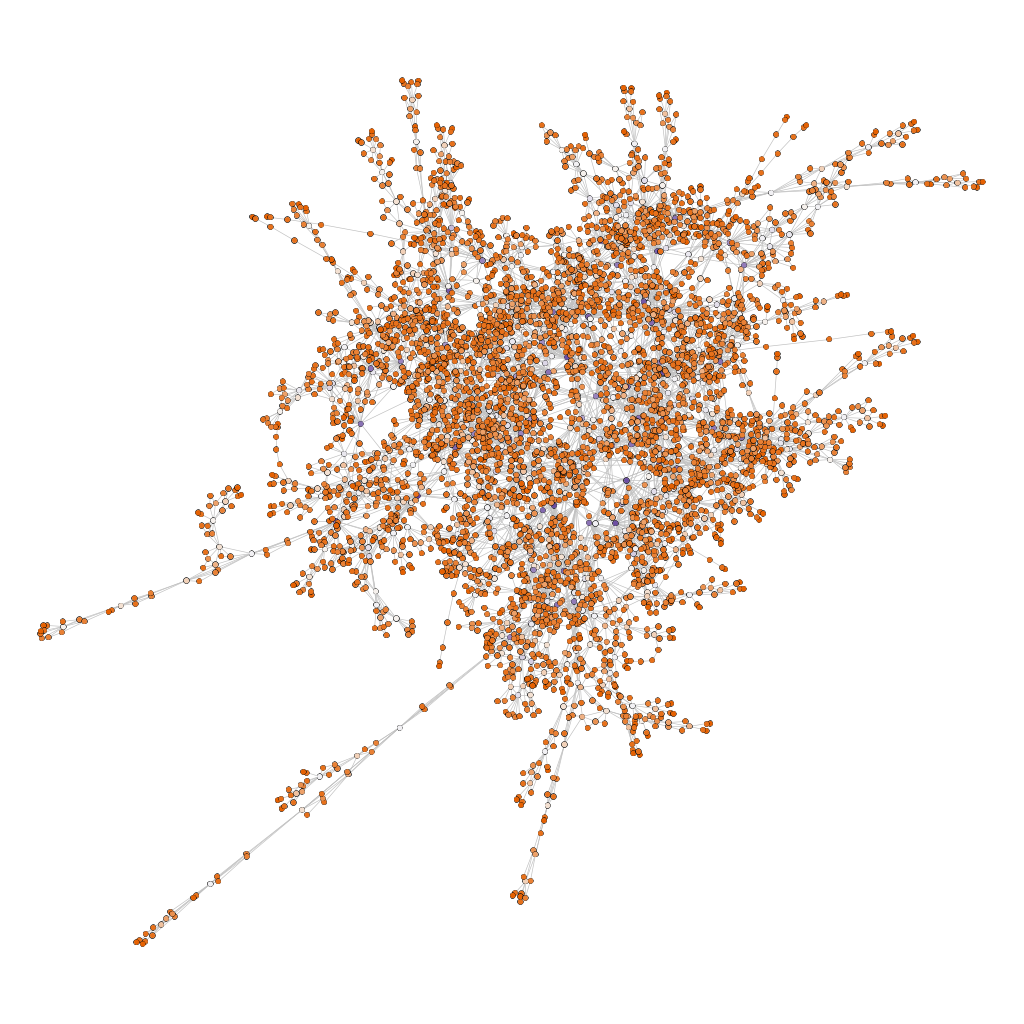
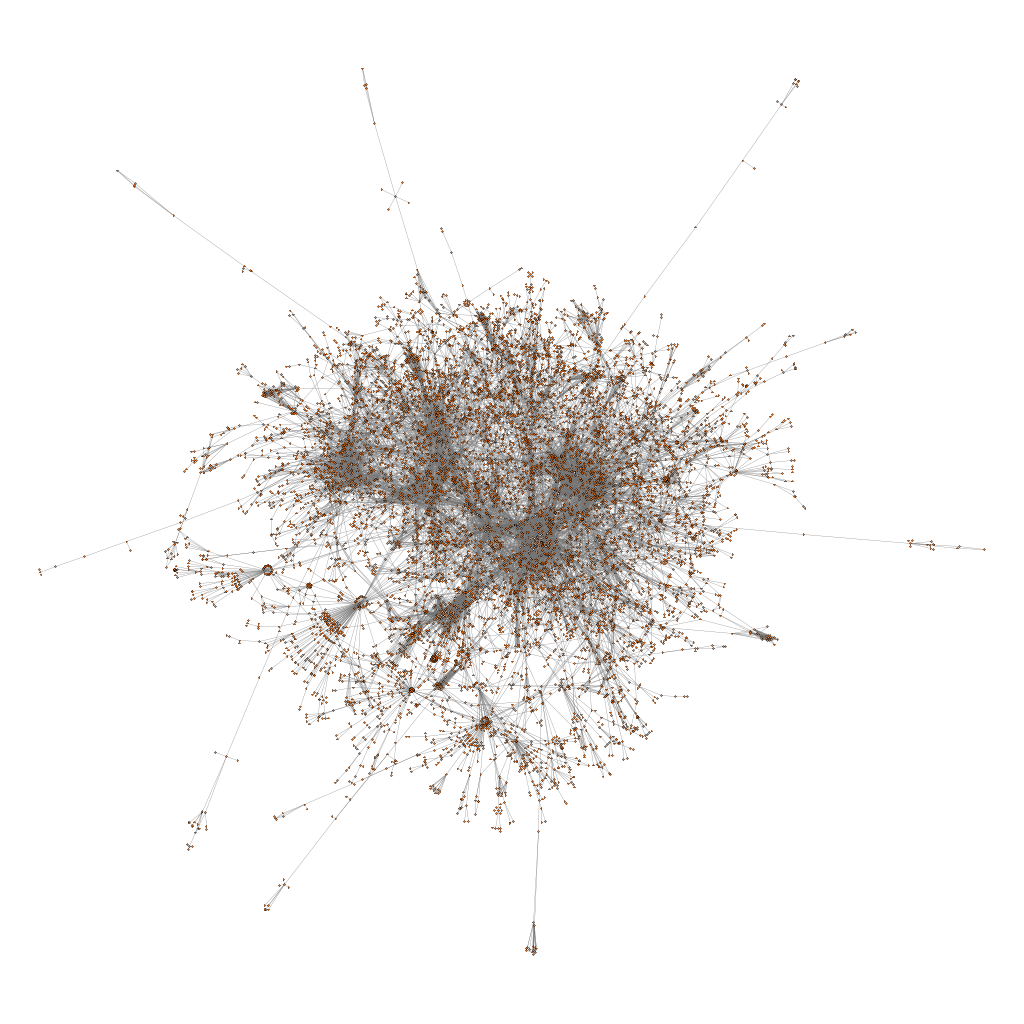
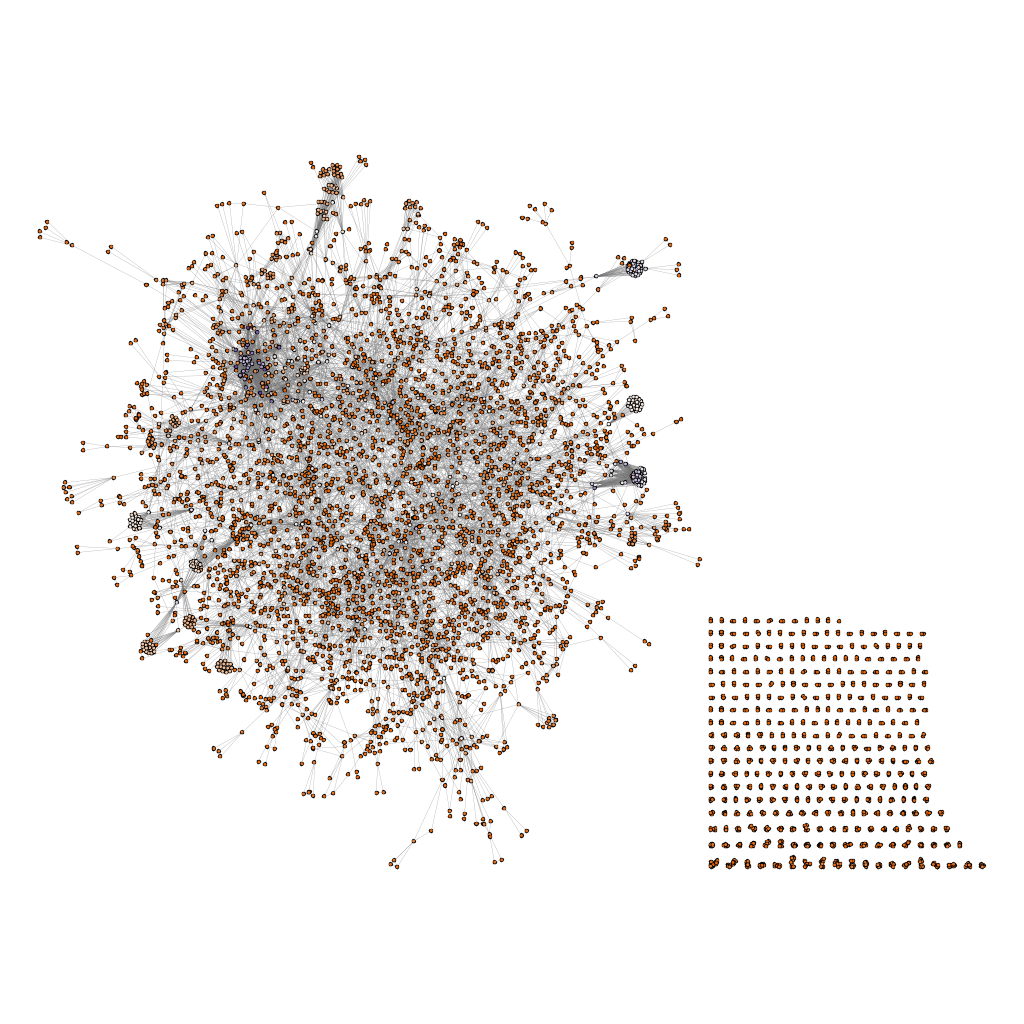
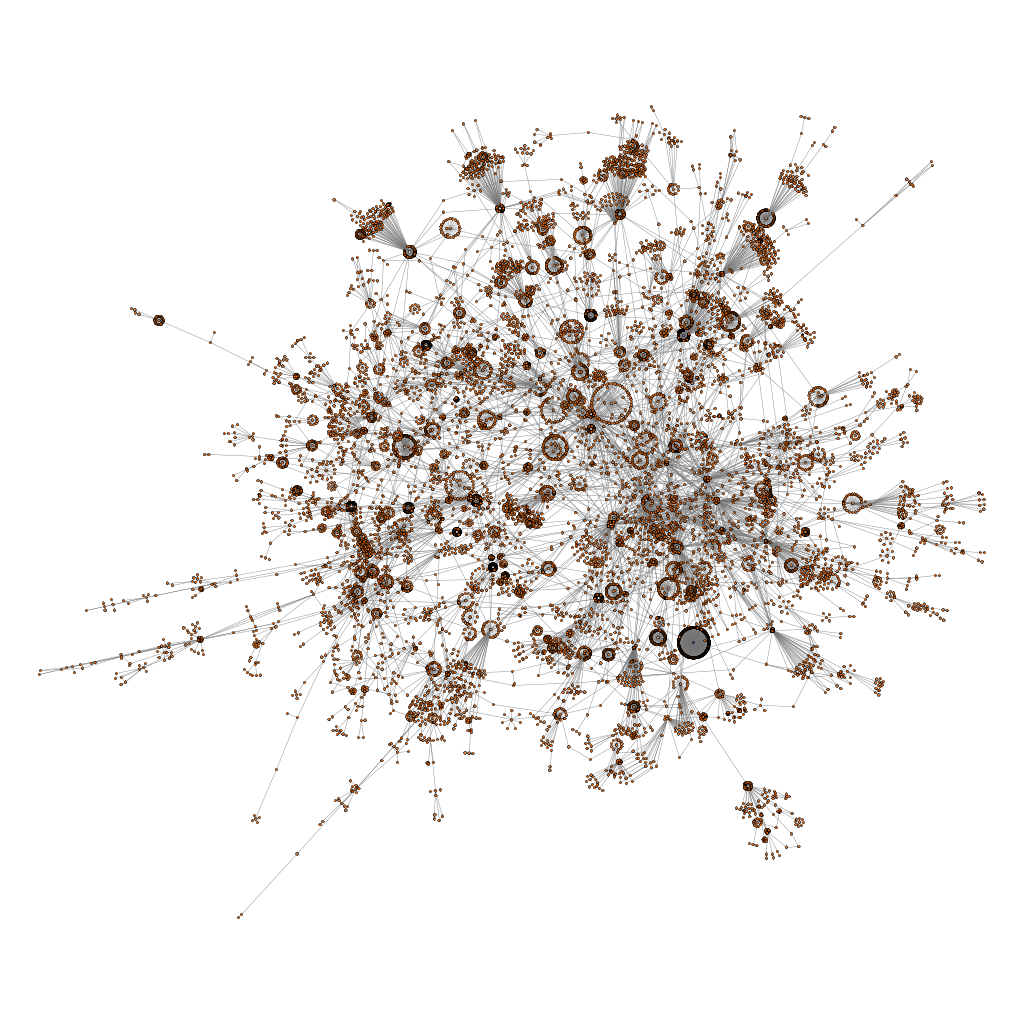
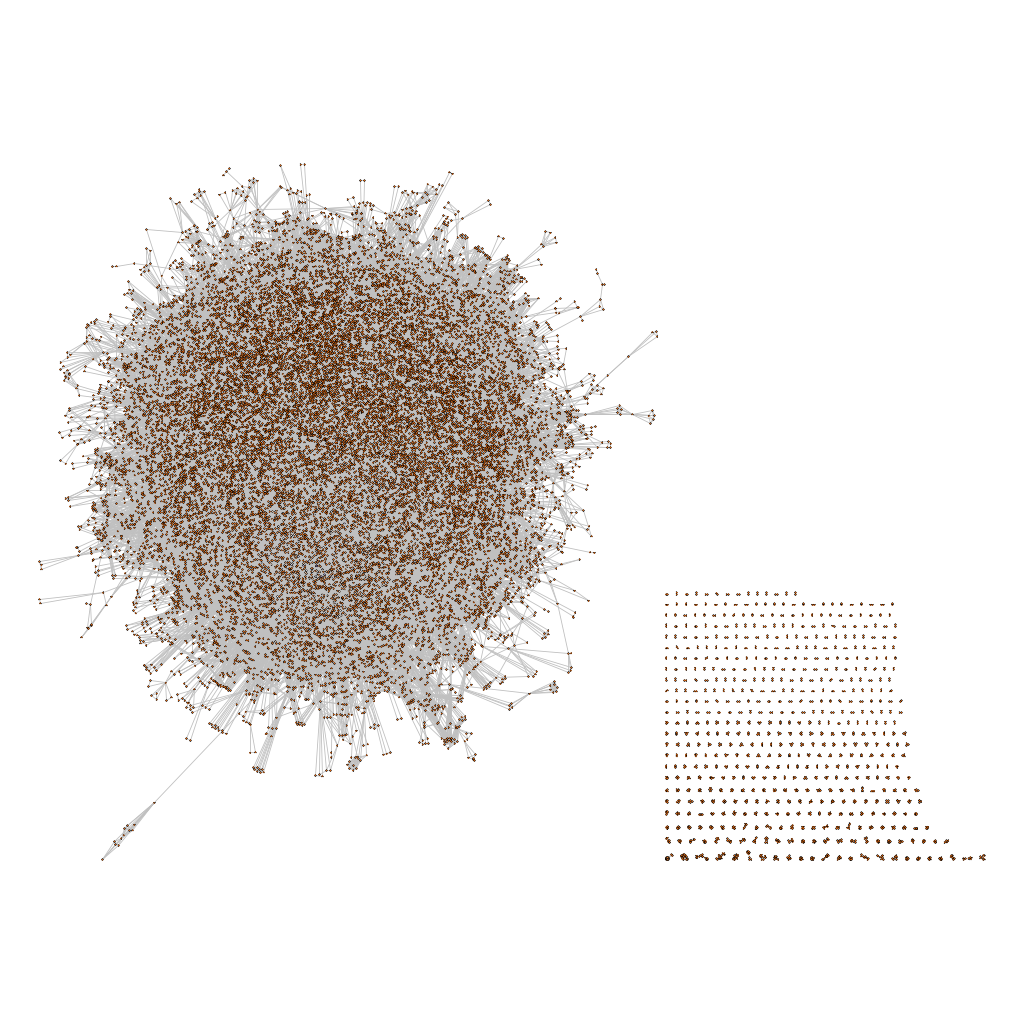
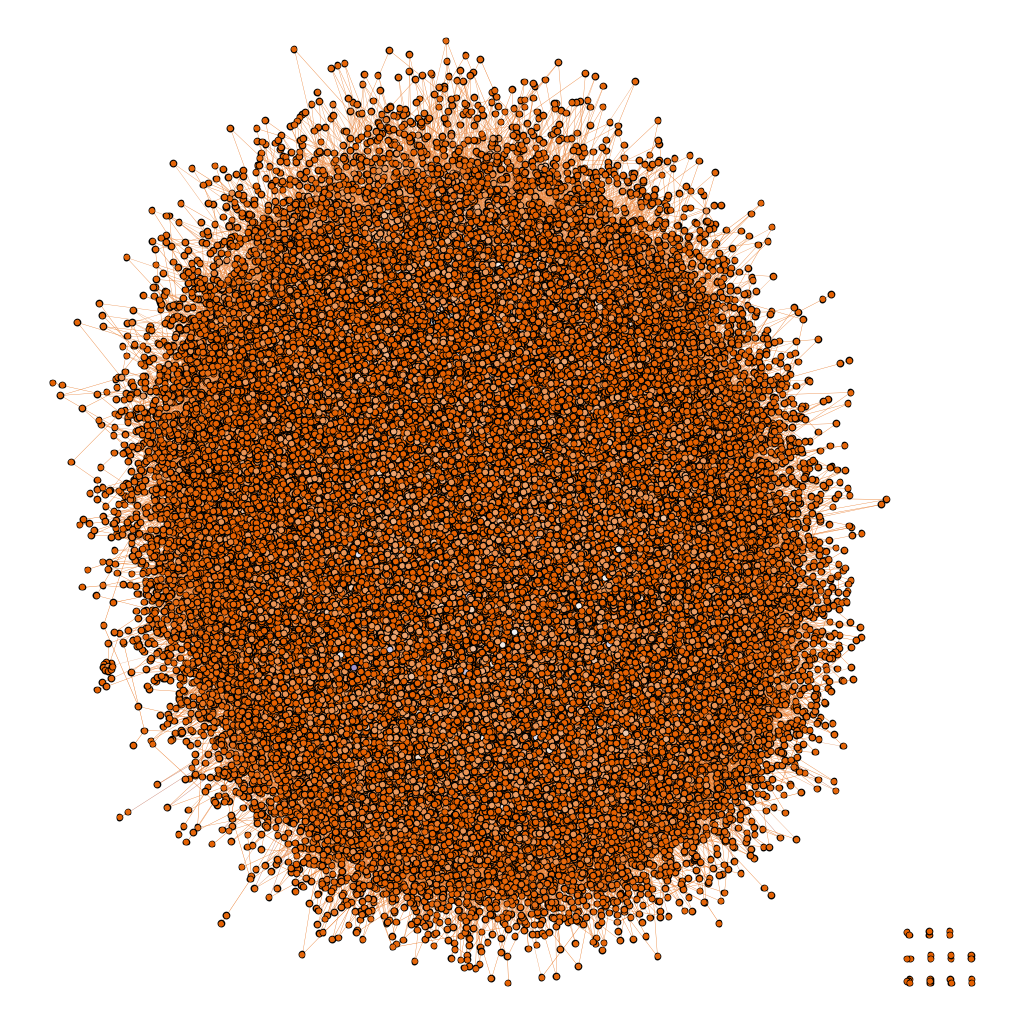
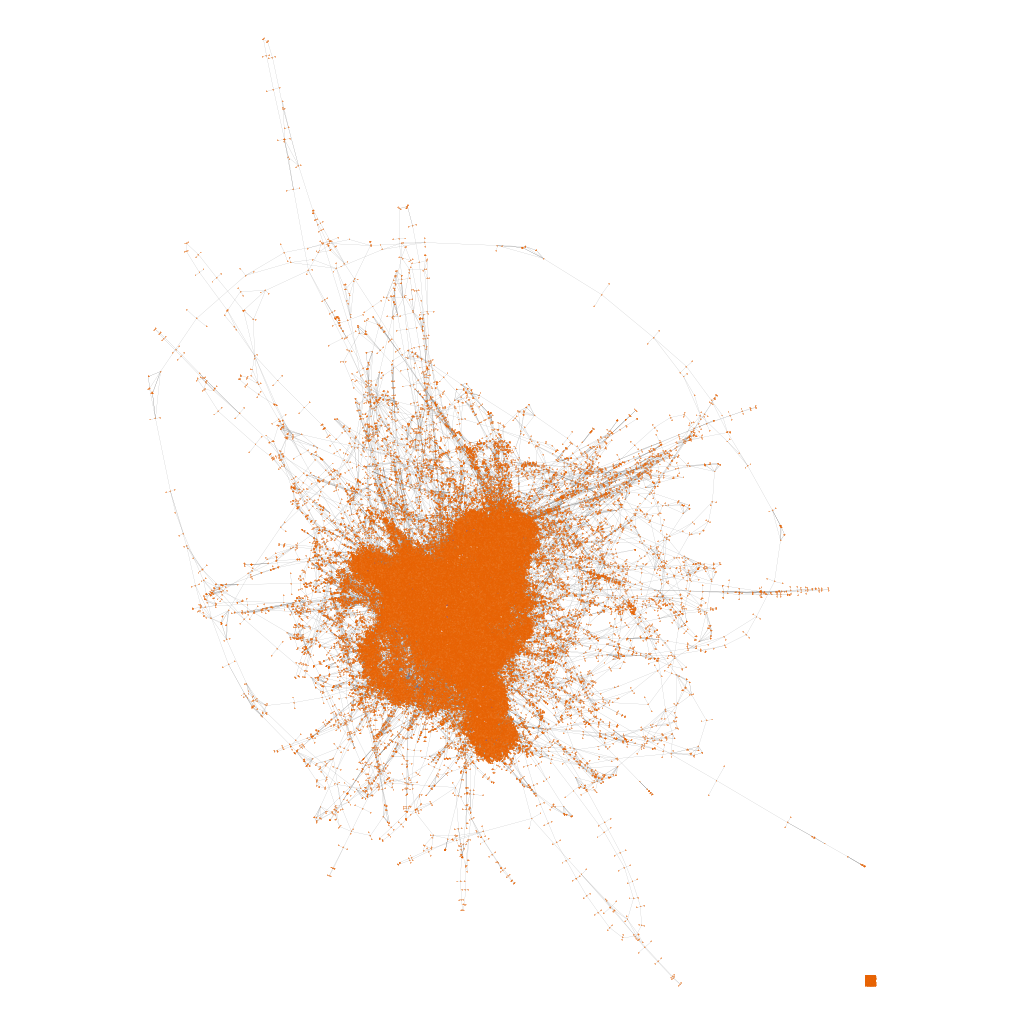
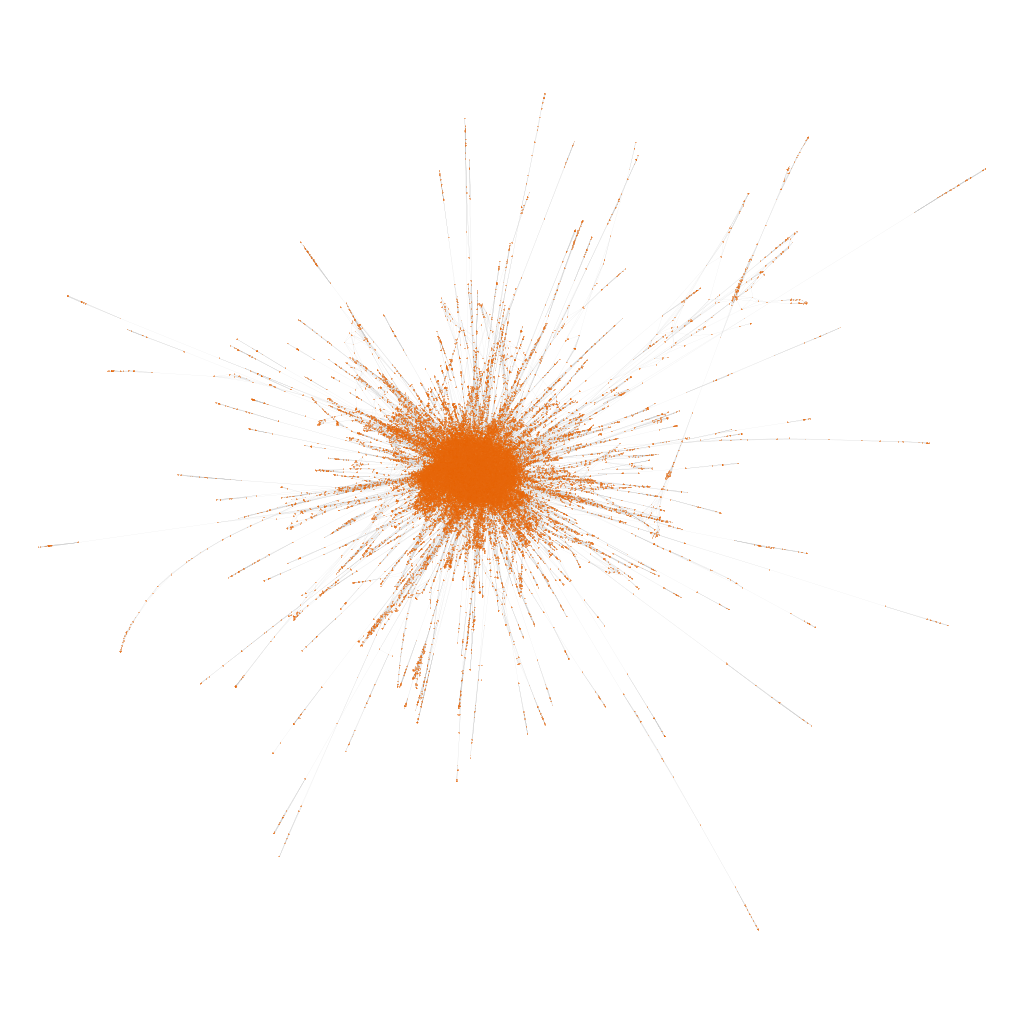
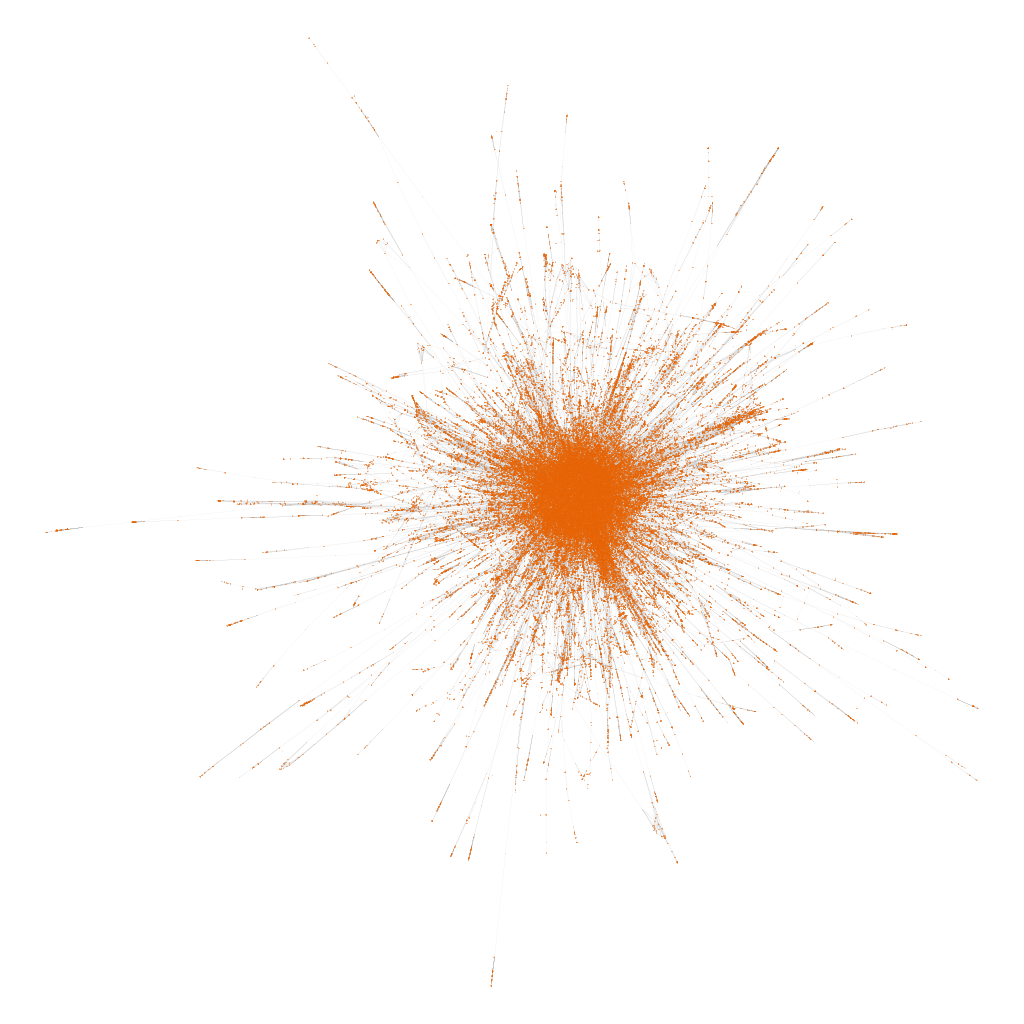
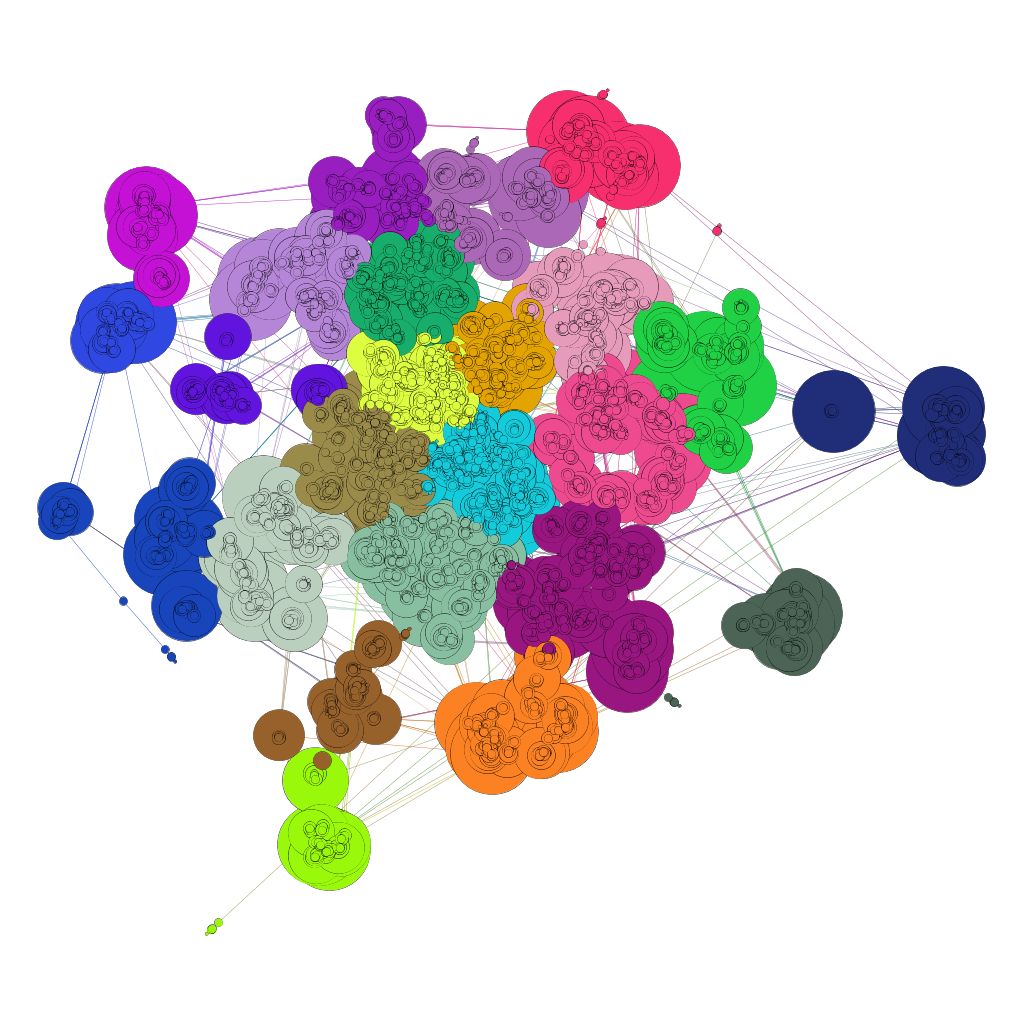
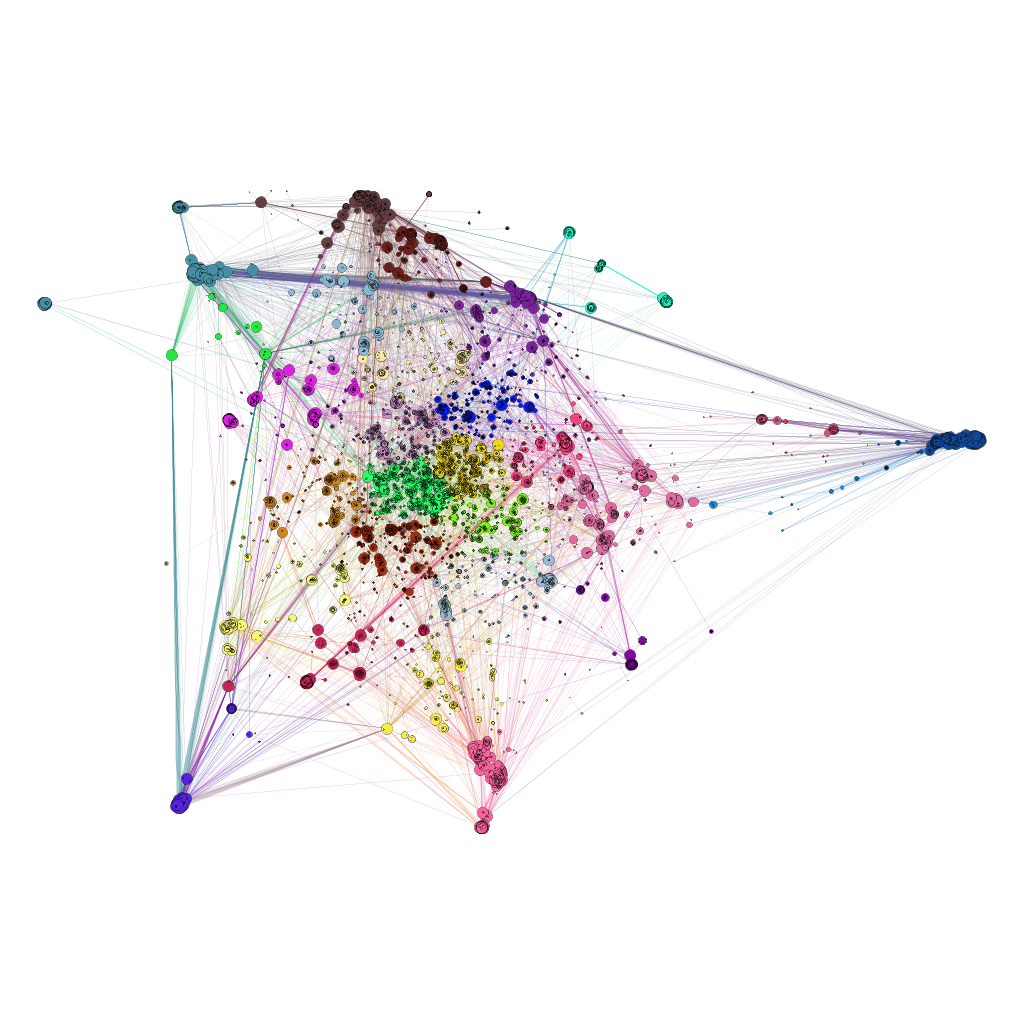
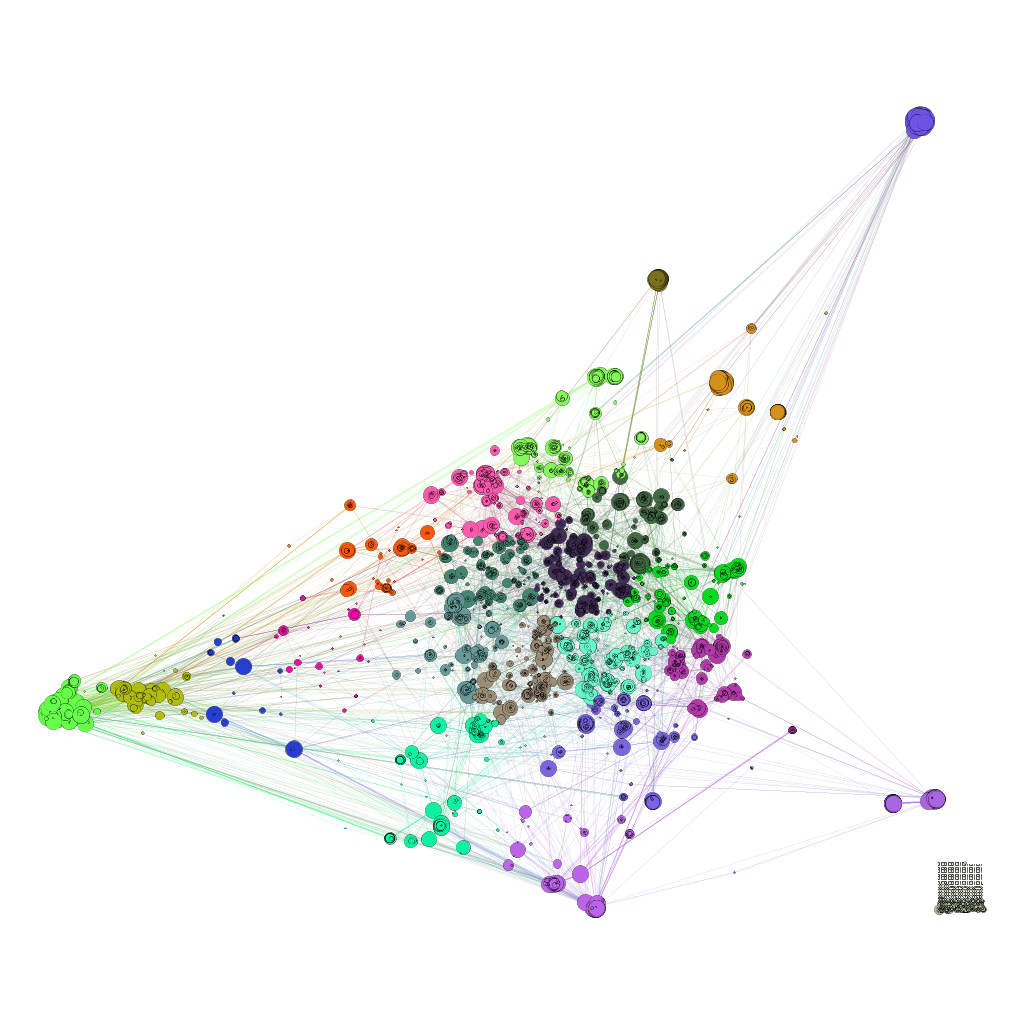
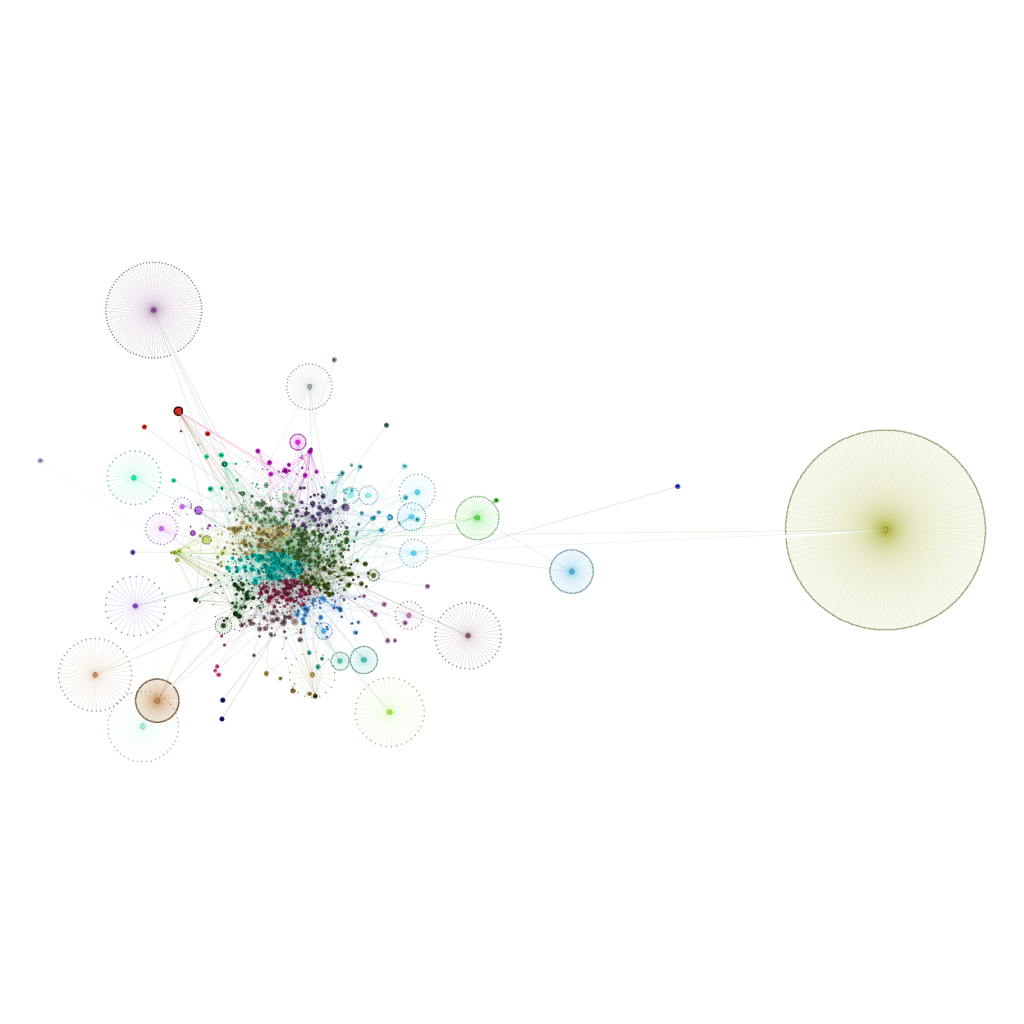
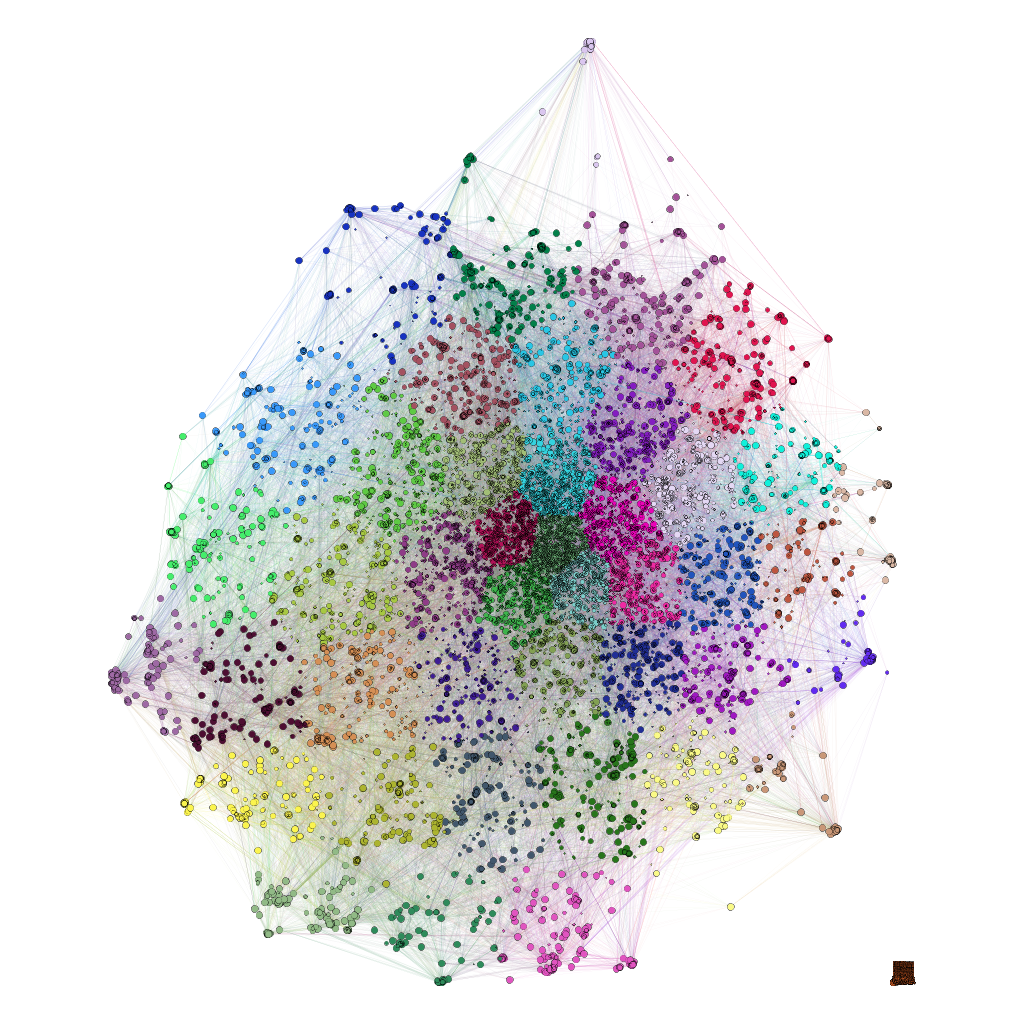
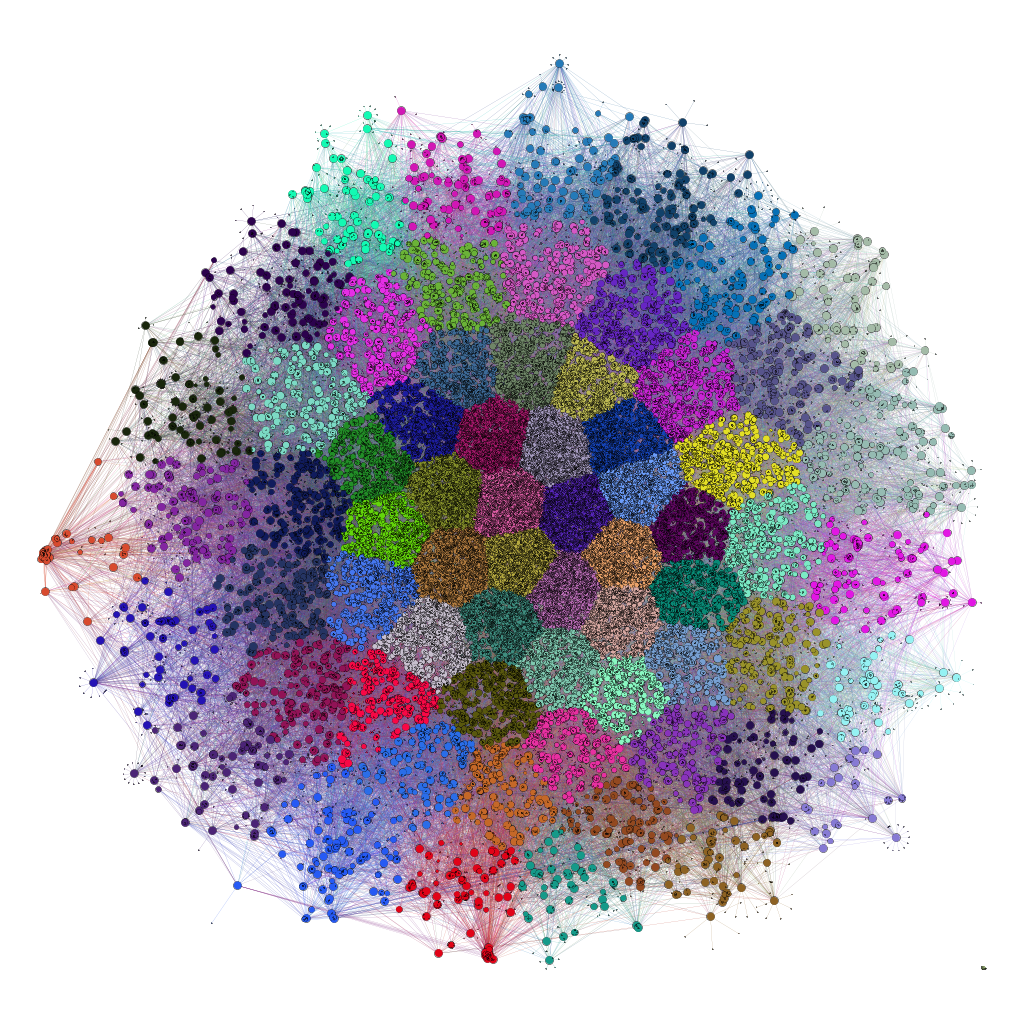
Graphs are ordered by size, with the first being the smallest (10K edges) the latest being the largest (1.5M edges); please refer to the archive to find out the exact sizes.
The following gallery contains drawings of graphs made with the Fruchterman-Reingold force model. The colouring is based on the vertices degree, from orange (lower degree) to white to purple (higher degree).
This gallery contains drawings of graphs made with the LinLog force model. The colouring is based on a K-Means clustering. Bigger vertices have higher degree than smaller ones.

